
“Discover the art of crafting TradingView indicators and mastering the art of duplicating these tools to enhance your trading prowess!”

How it works?
TradingView is a platform designed for studying cryptocurrencies and financial markets by presenting graphical representations and numerical values. An illustrative example of its utility is evident in the Binance chart system, which is built upon the TradingView framework. TradingView offers an extensive array of tools for both fundamental and technical analysis, encompassing features such as customizable charts, alerts, and more.
Within TradingView, indicators play a crucial role in analysis. These are tools that aid traders and analysts in understanding market trends and making informed decisions. Indicators leverage mathematical calculations on historical price and volume data, providing visual insights into market dynamics. Traders use these indicators to identify potential entry and exit points, assess market strength or weakness, and formulate strategies based on historical patterns and trends.
Pine Script™ is TradingView’s designated programming language, allowing traders to construct personalized trading tools and run them on the platform’s servers. Crafted as a lightweight yet powerful language, Pine Script™ is specifically designed for the development of indicators and strategies. Among the five available versions, only versions 4 and 5 are compatible with Chat GPT, streamlining the process of generating code based on the TradingView system information stored in Chat GPT’s database.
The procedure is straightforward: Chat GPT’s database is equipped with comprehensive information about the TradingView system, simplifying the code creation process using Pine Script™. Users can then effortlessly apply the generated code from Chat GPT to their TradingView chart through the dedicated Pine Script option.

☯ Create your Indicator! 🛟
Indicators created with Chat GPT differ for each user as the analysis of provided information (prompt) varies dynamically with each interaction. The complexity of these indicators depends on the user’s coding proficiency and crypto knowledge. There are various types of indicators, but all essentially rely on three crucial aspects: “the objective” representing the desired trading strategy; “the configurations” encompassing code symbols and analytical criteria tailored to the user’s knowledge; and finally, “the information” which signifies the outcomes derived from the code’s analysis applied to the received chart data.
Taking all these factors into account, indicators generated by Chat GPT tend to be simple and may contain numerous errors, potentially leading to instances where they do not function properly.
Chat GPT
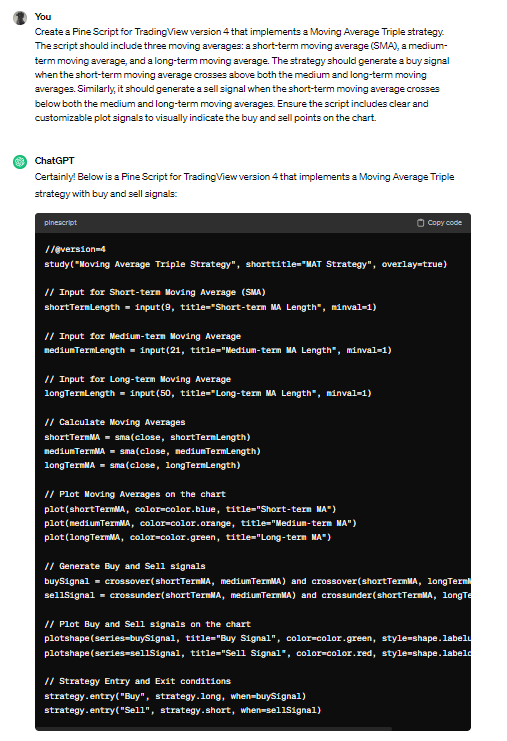
1- Preparation: Not scientifically proven, but there’s a notion that preparing a persona for Chat GPT can enhance its focus, so let’s give it a try.

2- Prompt: Once the persona has been established, you can input a prompt for the code you wish to generate, taking into account the three essential aspects. After generating the code, you can copy and paste it into the TradingView Pine Editor for further customization or immediate use.
Note: “In the second line of code, replace ‘study’ with ‘strategy’, because is a strategy code and can originate a code error .”
4- Access the Superchart: To access the Supercharts, select the cryptocurrency/market you want to analyze in the top-right corner using the three lines symbol. After making your selection, a page with the chosen cryptocurrency/market will appear. Click on “Supercharts” to proceed.

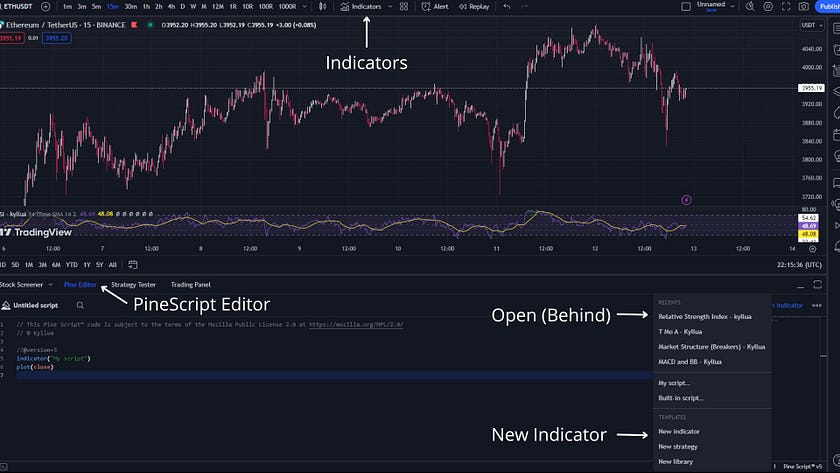
5- UI and API : In Supercharts, you can access your indicators on UI, including the ones you’ve saved, and your favorites. You can also add Tradeview indicators to the chart.
Additionally, access the Pine Editor in API. (If it doesn’t appear at the bottom of the page, open a free indicator from TradingView in “Indicators” and click on “{}” that appears on the open “indicator bar”.)
After opening the Pine Editor in API, click on the right on “Open”, and then select “New Indicator”. Some pre-written code should appear, similar to the one shown in the image.
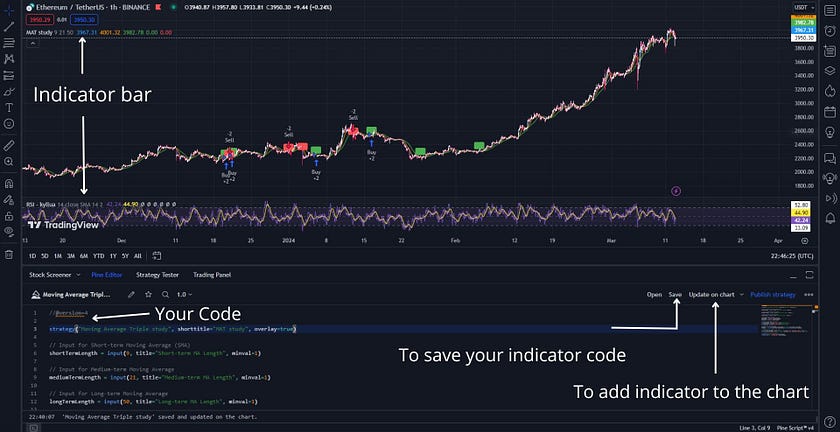
6- Code: Replace the old code with the new code by pasting the code you copied from Chat GPT and add it to the chart. (If you want to add text use “#…”).
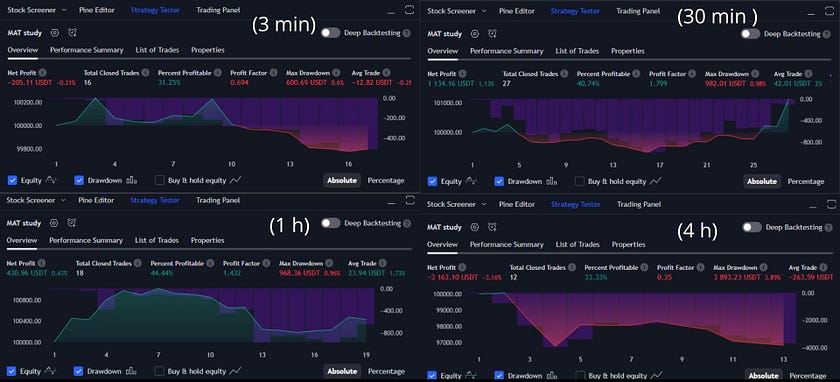
7- Test the code: You can evaluate the performance of the trade signals provided by the created indicator by accessing the “Strategy Tester” option. Adjust the time frames to determine which one is more suitable for the trades. In this instance, the 30-minute timeframe presents higher risk and more profit, while the 1-hour timeframe offers more reliable trades but with less profit.
Codes
Code used
// This Pine Script™ code is subject to the terms of the Mozilla Public License 2.0 at https://mozilla.org/MPL/2.0/
// © Kyllua

//@version=4
strategy("Moving Average Triple Strategy", shorttitle="MAT Strategy", overlay=true)

// Input for Short-term Moving Average (SMA)
shortTermLength = input(9, title="Short-term MA Length", minval=1)

// Input for Medium-term Moving Average
mediumTermLength = input(21, title="Medium-term MA Length", minval=1)

// Input for Long-term Moving Average
longTermLength = input(50, title="Long-term MA Length", minval=1)

// Calculate Moving Averages
shortTermMA = sma(close, shortTermLength)
mediumTermMA = sma(close, mediumTermLength)
longTermMA = sma(close, longTermLength)

// Plot Moving Averages on the chart
plot(shortTermMA, color=color.blue, title="Short-term MA")
plot(mediumTermMA, color=color.orange, title="Medium-term MA")
plot(longTermMA, color=color.green, title="Long-term MA")

// Generate Buy and Sell signals
buySignal = crossover(shortTermMA, mediumTermMA) and crossover(shortTermMA, longTermMA)
sellSignal = crossunder(shortTermMA, mediumTermMA) and crossunder(shortTermMA, longTermMA)

// Plot Buy and Sell signals on the chart
plotshape(series=buySignal, title="Buy Signal", color=color.green, style=shape.labelup, text="Buy")
plotshape(series=sellSignal, title="Sell Signal", color=color.red, style=shape.labeldown, text="Sell")

// Strategy Entry and Exit conditions
strategy.entry("Buy", strategy.long, when=buySignal)
strategy.entry("Sell", strategy.short, when=sellSignal)
A little surprise
To enhance the visual appeal of your chart, I’m sharing this indicator code with you all. Hope you find it enjoyable! TradingView
// This source code is subject to the terms of the Mozilla Public License 2.0 at https://mozilla.org/MPL/2.0/
// © Kyllua

// All credits to @Violent and Lemon's for creating the original code!

//@version=4

study(" Customizable MA Ribb - kyllua", shorttitle="kyllua MAR", overlay=true)

h1 = input(title = "──────────── kyllua MAR Settings ────────────", type=input.bool, defval = true)
source =   input(close, "  Source")
ma =       input(title="  MA Type", options=["SMA", "EMA", "WMA", "RMA", "ALMA", "VWMA", "HMA"], defval="SMA")
Theme =    input(title="  Theme", options=["Standard", "Classic", "Lemon", "Silver Surfer", "Watermelon", "Ethereal"], defval="Standard")
length =   input(defval=1, minval=1, title="  Length", type=input.integer)
start =    input(defval=5, minval=1, title="  Start", type=input.integer)
maNumber = input(defval=32, minval=1, maxval=32, title="  How many MAs?", type=input.integer)
colorFrom=input(defval=false, title="Color Smoothing?", type=input.bool)

color1 = color.new(#008cff, 25)
color2 = color.new(#41464b, 25)
color3 = color.new(#43ff43, 25)
color4 = color.new(#ff0d0d, 25)
color5 = color.new(#ffff00, 25)
color6 = color.new(#00ff00, 25)
color7 = color.new(color.silver, 0)
color8 = color.new(#353535, 0)
color9 = color.new(#24e828, 25)
color10 = color.new(#ff357e, 25)
color11 = color.new(color.teal, 25)
color12 = color.new(color.purple, 25)

c1 = Theme == "Standard" ? color1 : Theme == "Classic" ? color3 : Theme == "Lemon" ? color5 : Theme == "Silver Surfer" ? color7 : Theme == "Watermelon" ? color9 : Theme == "Ethereal" ? color11 : na
c2 = Theme == "Standard" ? color2 : Theme == "Classic" ? color4 : Theme == "Lemon" ? color6 : Theme == "Silver Surfer" ? color8 : Theme == "Watermelon" ? color10 : Theme == "Ethereal" ? color12 : na

count = length * start

getMa(c)=>
    l = count + (length * c)
    if(ma == "SMA")
        sma(source, l)
    else
        if(ma == "EMA")
            ema(source, l)
        else
            if(ma == "WMA")
                wma(source, l)
            else
                if(ma == "RMA")
                    rma(source, l)
                else
                    if(ma == "ALMA")
                        alma(source, l, 0, 2)
                    else
                        if(ma == "VWMA")
                            vwma(source, l)
                        else
                            if(ma == "HMA")
                                hma(source, l)

sma1 =  maNumber >= 1  ? getMa(0 ) : na
sma2 =  maNumber >= 2  ? getMa(1 ) : na
sma3 =  maNumber >= 3  ? getMa(2 ) : na
sma4 =  maNumber >= 4  ? getMa(3 ) : na
sma5 =  maNumber >= 5  ? getMa(4 ) : na
sma6 =  maNumber >= 6  ? getMa(5 ) : na
sma7 =  maNumber >= 7  ? getMa(6 ) : na
sma8 =  maNumber >= 8  ? getMa(7 ) : na
sma9 =  maNumber >= 9  ? getMa(8 ) : na
sma10 = maNumber >= 10 ? getMa(9 ) : na
sma11 = maNumber >= 11 ? getMa(10) : na
sma12 = maNumber >= 12 ? getMa(11) : na
sma13 = maNumber >= 13 ? getMa(12) : na
sma14 = maNumber >= 14 ? getMa(13) : na
sma15 = maNumber >= 15 ? getMa(14) : na
sma16 = maNumber >= 16 ? getMa(15) : na
sma17 = maNumber >= 17 ? getMa(16) : na
sma18 = maNumber >= 18 ? getMa(17) : na
sma19 = maNumber >= 19 ? getMa(18) : na
sma20 = maNumber >= 20 ? getMa(19) : na
sma21 = maNumber >= 21 ? getMa(20) : na
sma22 = maNumber >= 22 ? getMa(21) : na
sma23 = maNumber >= 23 ? getMa(22) : na
sma24 = maNumber >= 24 ? getMa(23) : na
sma25 = maNumber >= 25 ? getMa(24) : na
sma26 = maNumber >= 26 ? getMa(25) : na
sma27 = maNumber >= 27 ? getMa(26) : na
sma28 = maNumber >= 28 ? getMa(27) : na
sma29 = maNumber >= 29 ? getMa(28) : na
sma30 = maNumber >= 30 ? getMa(29) : na
sma31 = maNumber >= 31 ? getMa(30) : na
sma32 = maNumber >= 32 ? getMa(31) : na

plot(sma32,  color=(not colorFrom and sma32 <= source) or (colorFrom and sma32 <= sma31) ? c1 : c2, title="MA32", linewidth=1, style=plot.style_line, transp=0)
plot(sma31,  color=(not colorFrom and sma31 <= source) or (colorFrom and sma31 <= sma30) ? c1 : c2, title="MA31", linewidth=1, style=plot.style_line, transp=0)
plot(sma30,  color=(not colorFrom and sma30 <= source) or (colorFrom and sma30 <= sma29) ? c1 : c2, title="MA30", linewidth=1, style=plot.style_line, transp=0)
plot(sma29,  color=(not colorFrom and sma29 <= source) or (colorFrom and sma29 <= sma28) ? c1 : c2, title="MA29", linewidth=1, style=plot.style_line, transp=0)
plot(sma28,  color=(not colorFrom and sma28 <= source) or (colorFrom and sma28 <= sma27) ? c1 : c2, title="MA28", linewidth=1, style=plot.style_line, transp=0)
plot(sma27,  color=(not colorFrom and sma27 <= source) or (colorFrom and sma27 <= sma26) ? c1 : c2, title="MA27", linewidth=1, style=plot.style_line, transp=0)
plot(sma26,  color=(not colorFrom and sma26 <= source) or (colorFrom and sma26 <= sma25) ? c1 : c2, title="MA26", linewidth=1, style=plot.style_line, transp=0)
plot(sma25,  color=(not colorFrom and sma25 <= source) or (colorFrom and sma25 <= sma24) ? c1 : c2, title="MA25", linewidth=1, style=plot.style_line, transp=0)
plot(sma24,  color=(not colorFrom and sma24 <= source) or (colorFrom and sma24 <= sma23) ? c1 : c2, title="MA24", linewidth=1, style=plot.style_line, transp=0)
plot(sma23,  color=(not colorFrom and sma23 <= source) or (colorFrom and sma23 <= sma22) ? c1 : c2, title="MA23", linewidth=1, style=plot.style_line, transp=0)
plot(sma22,  color=(not colorFrom and sma22 <= source) or (colorFrom and sma22 <= sma21) ? c1 : c2, title="MA22", linewidth=1, style=plot.style_line, transp=0)
plot(sma21,  color=(not colorFrom and sma21 <= source) or (colorFrom and sma21 <= sma20) ? c1 : c2, title="MA21", linewidth=1, style=plot.style_line, transp=0)
plot(sma20,  color=(not colorFrom and sma20 <= source) or (colorFrom and sma20 <= sma19) ? c1 : c2, title="MA20", linewidth=1, style=plot.style_line, transp=0)
plot(sma19,  color=(not colorFrom and sma19 <= source) or (colorFrom and sma19 <= sma18) ? c1 : c2, title="MA19", linewidth=1, style=plot.style_line, transp=0)
plot(sma18,  color=(not colorFrom and sma18 <= source) or (colorFrom and sma18 <= sma17) ? c1 : c2, title="MA18", linewidth=1, style=plot.style_line, transp=0)
plot(sma17,  color=(not colorFrom and sma17 <= source) or (colorFrom and sma17 <= sma16) ? c1 : c2, title="MA17", linewidth=1, style=plot.style_line, transp=0)
plot(sma16,  color=(not colorFrom and sma16 <= source) or (colorFrom and sma16 <= sma15) ? c1 : c2, title="MA16", linewidth=1, style=plot.style_line, transp=0)
plot(sma15,  color=(not colorFrom and sma15 <= source) or (colorFrom and sma15 <= sma14) ? c1 : c2, title="MA15", linewidth=1, style=plot.style_line, transp=0)
plot(sma14,  color=(not colorFrom and sma14 <= source) or (colorFrom and sma14 <= sma13) ? c1 : c2, title="MA14", linewidth=1, style=plot.style_line, transp=0)
plot(sma13,  color=(not colorFrom and sma13 <= source) or (colorFrom and sma13 <= sma12) ? c1 : c2, title="MA13", linewidth=1, style=plot.style_line, transp=0)
plot(sma12,  color=(not colorFrom and sma12 <= source) or (colorFrom and sma12 <= sma11) ? c1 : c2, title="MA12", linewidth=1, style=plot.style_line, transp=0)
plot(sma11,  color=(not colorFrom and sma11 <= source) or (colorFrom and sma11 <= sma10) ? c1 : c2, title="MA11", linewidth=1, style=plot.style_line, transp=0)
plot(sma10,  color=(not colorFrom and sma10 <= source) or (colorFrom and sma10 <= sma9)  ? c1 : c2, title="MA10", linewidth=1, style=plot.style_line, transp=0)
plot(sma9 ,  color=(not colorFrom and sma9  <= source) or (colorFrom and sma9  <= sma8)  ? c1 : c2, title="MA9" , linewidth=1, style=plot.style_line, transp=0)
plot(sma8 ,  color=(not colorFrom and sma8  <= source) or (colorFrom and sma8  <= sma7)  ? c1 : c2, title="MA8" , linewidth=1, style=plot.style_line, transp=0)
plot(sma7 ,  color=(not colorFrom and sma7  <= source) or (colorFrom and sma7  <= sma6)  ? c1 : c2, title="MA7" , linewidth=1, style=plot.style_line, transp=0)
plot(sma6 ,  color=(not colorFrom and sma6  <= source) or (colorFrom and sma6  <= sma5)  ? c1 : c2, title="MA6" , linewidth=1, style=plot.style_line, transp=0)
plot(sma5 ,  color=(not colorFrom and sma5  <= source) or (colorFrom and sma5  <= sma4)  ? c1 : c2, title="MA5" , linewidth=1, style=plot.style_line, transp=0)
plot(sma4 ,  color=(not colorFrom and sma4  <= source) or (colorFrom and sma4  <= sma3)  ? c1 : c2, title="MA4" , linewidth=1, style=plot.style_line, transp=0)
plot(sma3 ,  color=(not colorFrom and sma3  <= source) or (colorFrom and sma3  <= sma2)  ? c1 : c2, title="MA3" , linewidth=1, style=plot.style_line, transp=0)
plot(sma2 ,  color=(not colorFrom and sma2  <= source) or (colorFrom and sma2  <= sma1)  ? c1 : c2, title="MA2" , linewidth=1, style=plot.style_line, transp=0)
plot(sma1 ,  color=(not colorFrom and sma1  <= source) or (colorFrom and sma1  <= source)? c1 : c2, title="MA1" , linewidth=1, style=plot.style_line, transp=0)

//
Leave a Reply